Yearly and weekly market summary
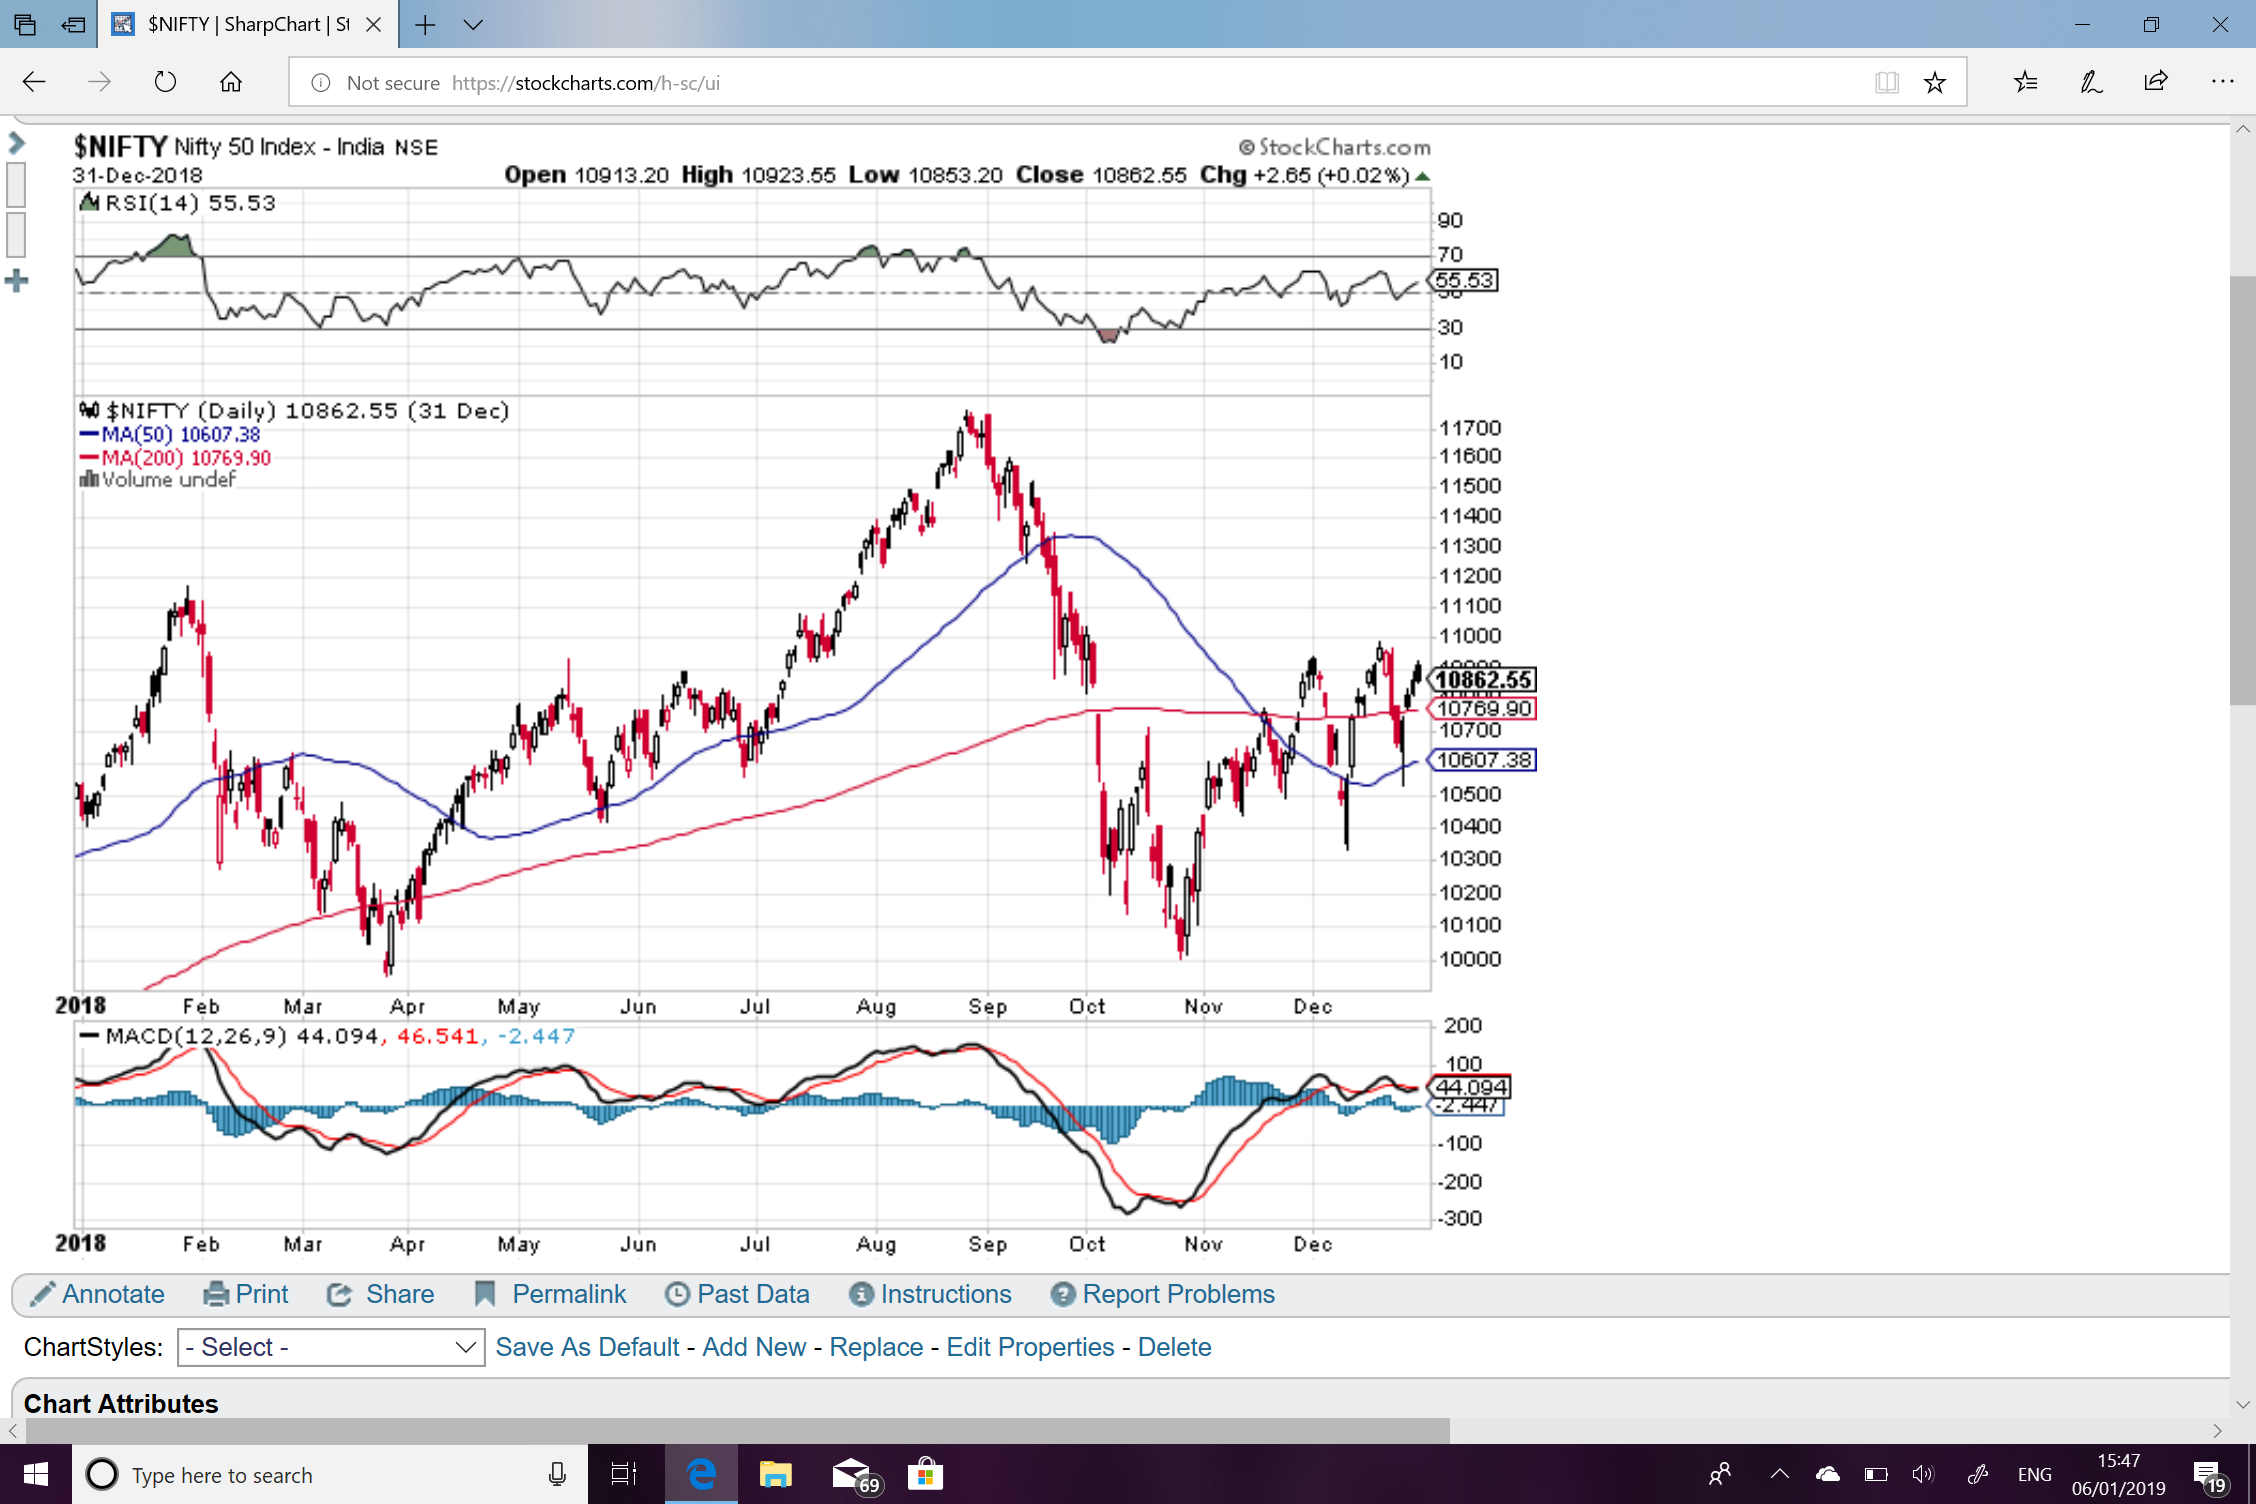
Yearly: The year 2018 started off with euphoria, but ended with pessimism or I would rather say with “caution”. If we look at calendar yearly performance on index Nifty from 31-12-17 to 31-12-18, we found that nothing much has happened; the year was predominantly flat with a gain of only 374 points as depicted in chart below. However, it felt like a lot has happened as the volatility was quite high throughout the year. The Nifty established a broad range with a high of 11760 and low at 9951. Finally, Nifty bid adieu the year at the middle of the range at 10862. Sectorial performance caught my attention, auto’s and metals were down by 20-30%, midcaps were down by 30-50-%, NBFC’s were down by 30-50%, although very few large caps are near to their highs. In nutshell, we can say the year 2018 was a sector and stock specific year.
Weekly: In the first week of 2019 including the last day of 2018, the benchmark Sensex was down by 381 points or 1.06% to close at 35695, and Nifty lost 132 points or 1.22%, settled at 10727.
Current Outlook and New Year Forecast
The broad market environment is perhaps the single most important factor to consider when selecting a trading or investing strategy for stocks. As with the weather, the broad market environment is subject to change and we need to adapt to current conditions. We should take extra precautions when volatility is high or until the environment improves. Ideally, in bull market growth stock outperform the value stock like auto’s and NBFC’s belonged to growth category and they outperformed the broader market until early 2018; the cycle started in 2011-12, but they ended up with sharp fall in their prices. I expect they will continue to underperform the broader market for at least a year.
Moreover, the stocks which are near to their all time high witnessing a decrease in momentum along with negative divergence on long-term monthly chart on technical indicators like RSI (Relative strength index) and MACD (Moving average convergence divergence) which normally resolves by downtrend in price action. In past twenty years, most of the time negative divergence on monthly chart lead to a steep correction in stock price specially to those who are trading at higher valuation, the best example is auto stocks all of them had a negative divergence and high valuation before they plunged.
In addition to that I think early 2018 was the year of stopping in upside momentum and decided the top for the secular bull market which started in 2009-10. Most importantly, it was the year of distribution that was quite apparent in weak market breadth for most of the year. I think distribution will continue for some more time in this year and thereafter we can see a mark down phase. Hence, outcome is not very positive.
Conclusion
One has to consider that for the time being market seems to be in an innocuous trading range and range is becoming narrow after every week. Three times Nifty has taken a resistance at 10900 and support is climbing upward, the given formation look like an ascending triangle or bearish wedge which eventually resolves with breakout or breakdown. This portend a rally of some magnitude is coming that could cause a ruckus. Hence, it is pertinent to be vigilante until Nifty break that trading range by the time I continue to believe that we have entered in a bear market.
I welcome any feedback you may have about the content of this article.
Profitable new Year..!; Be a Savvy Investor..!!
Pankaj