
Weekly Market Recap
Markets dived, ended the worst consecutive second week in the history of the stocks market as NIFTY entered in the year of 2014 amid dire warnings about the economic effects of the coronavirus pandemic as governments stepped up efforts to keep people at home.
In the worst week gone by the benchmark SENSEX tanked 4187 points, or 12.28% to close at 29915, similarly, NIFTY plunged 1209 points, or 12.15% settled at 8745. While BANKNIFTY lead the downtrend and was down whopping 19.27%.
Current Outlook
Last week, I wrote and thought about anguish overdone…? but VIX tells something else. Well, VIX was telling us the truth and market ardently dived though we saw some bounce on Friday. I also stated that on daily charts the market appears to be highly oversold, however, weekly and monthly charts had enough room to fall further, precisely that happened this week. This week internals got oversold in all the time frames, perhaps that’s the reason we witnessed a rally of some magnitude on Friday.
Technically, after such a dramatic and unfathomable downfall the rally or rebound of some magnitude is quite obvious. It is quite possible after falling incessantly we can see the market to rally further, but I think it would be fragile and highly susceptible to correct sharply at any time.
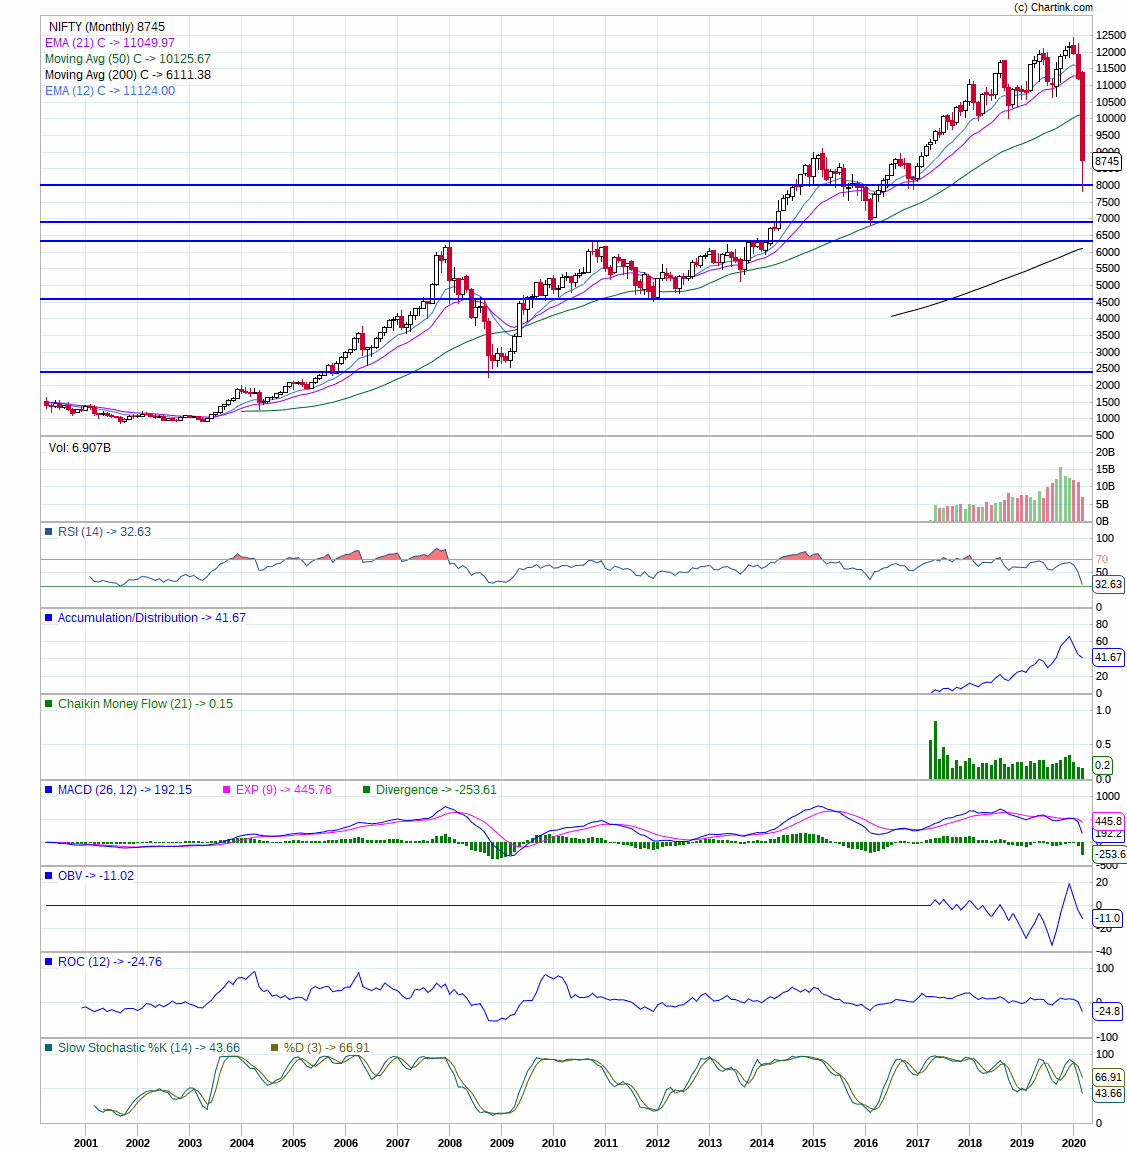
So far, from the low of 2008 to the high of January 2020 NIFTY has corrected more than 40%. When we look for downside potential for the NIFTY, the simplest way is to look at obvious support levels based upon lines drawn across prior significant highs and lows as depicted in the chart below. Over the last 20 years that includes:
- December 2016 low at 7893 after making a double top formation. It was penetrated on Thursday.
- February 2016 bear market low at 6825.
- The top of the 2008, 2010 and Jan 2014 at 6380 which is 60% correction from high.
- Jan 2012 low at 4850.
- Oct 2008 bear market low at 2360 which is 100% correction.
Certainly, everything up to a 60% decline is possible, even likely — it has happened twice before in the last 20 years, and the market is already down over -38%. But is a mind-boggling decline to the 2008 low possible? It sounds crazy, but I’m not ruling it out.
Conclusion
I don’t know where the range band levels or support will be, but by using some of the proposed technical support levels this chart shows where they may end up. (See the horizontal blue lines. If things continue to deteriorate, there will eventually be good and bad news: Stocks will be really cheap . . . if we have any money left to buy them.
Feedback, comments, suggestion or questions are welcome at below comment section or at pankaj@savvycapital.co.in.
Stick to your Investing model…!; Be a Savvy Investor..!!
Pankaj