
Weekly Market Recap
Wow…!! what a stellar and improbable rally we saw this week, market choose the path, which was least expected to follow, but NIFTY bluntly indicated on Wednesday for the next day rally that I will enunciate below. Perhaps, the cause of the rally is monthly derivative expiry which happened to be on last Thursday of every month that might have further fueled up by short covering. Whatever be the reason the rally certainly was eye-popping and tantalizing.
In the week gone by, the benchmark SENSEX gained whopping 2390 points, or 7.63%, close at 33717. Similarly, NIFTY surged by 707 points, or 7.71% to settle at 9860.
Current Outlook
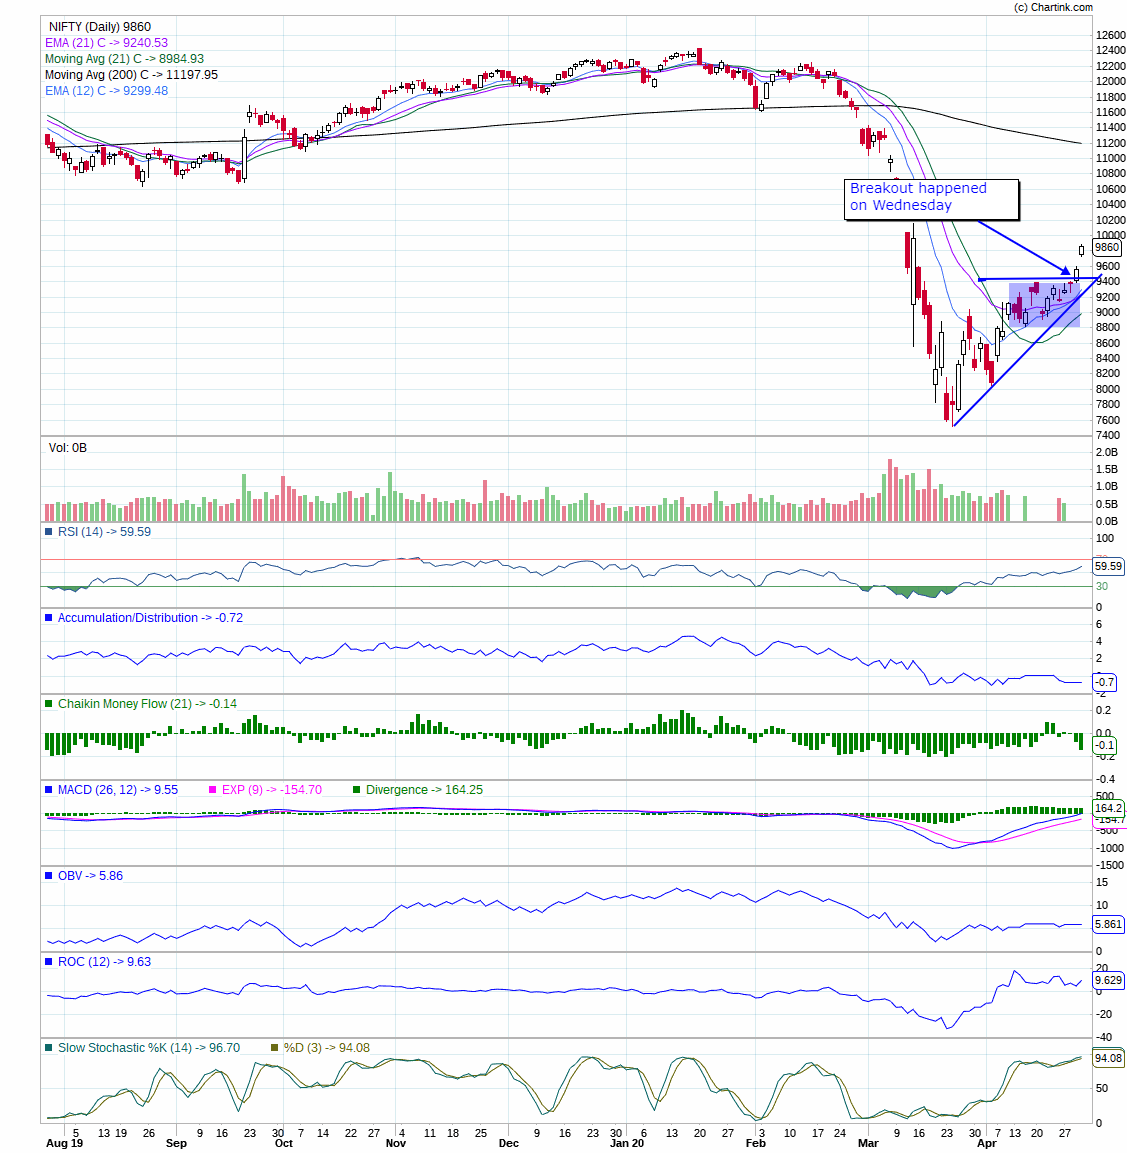
There is some ambiguity as we have different, but interesting configuration on both daily and weekly chart as can be seen in the charts below. On daily chart, for last few days NIFTY, had a congested and narrow trading sessions as manifested in the shaded portion on the chart that turned out the formation into the sort of ascending triangle (outlined by blue lines) which had ostensibly broken-out on Wednesday that indicated the price would advance further sharply. Precisely, the same happened on Thursday.
Daily Chart
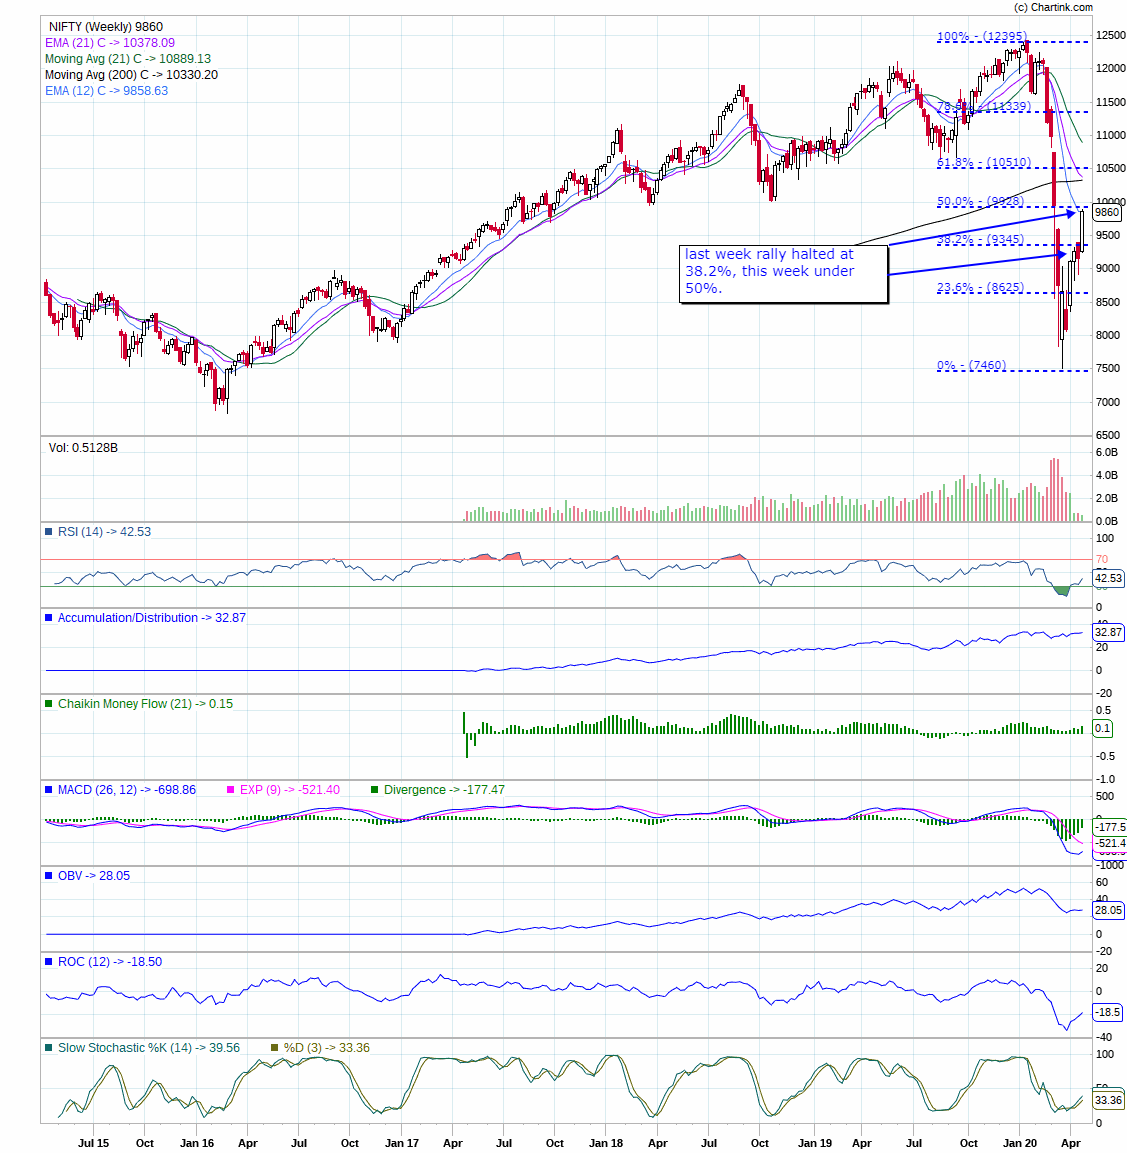
Last week, I mentioned about the Fibonacci retracement on the weekly chart. Until last week, the price was precisely halted at 38.2% and, in addition, deteriorating market conditions like weak breadth along with some negative divergence with VIX, suggested me to expect a pullback of some magnitude, however, that’s proven to be otherwise and NIFTY rallied further straight up to the 50% retracement level. That again suggest, we can expect a pull back as rally from bottom seems to be quite precipitous, ideally which is fragile and untoward to sustain.
Weekly Chart
Unimpeachable, breakout on daily chart suggest continuation in uptrend for NIFTY, however, in contrast, SGX NIFTY indicating a downfall of more than 500 points in NIFTY on Monday as Indian market were closed on Friday. It is quite perplexed. If that happens it would become a case of falls breakout on daily chart which is pernicious because false breakouts are often followed by above-average price trends in the opposite direction of the original signal. Furthermore, it is indispensable to watch out for the VIX as it has dwindled down significantly from unprecedented high level that has created a room to spike again.
Ipso facto, it is, however, apposite to wait patiently before we consider the given conditions propitious for buying. Hence, current outlook still appears to be gloomy.
Conclusion
Without trying to predict the future, after combining both daily and weekly time frames my confidence in daily chart buying signal is not high. The market is moving too fast, and it has moved too far, and we may get whipsaw buy or sell signals under those conditions. It may prove to be a profitable signal, but the setup is weak. Caution is warranted for buyers.
Feedback, comments, suggestion or questions are welcome at below comment section or at [email protected].
Keep exploring…!, Be a Savvy Investor..!!
Pankaj